Anyway, back to the topic! In the previous post, I was talking about the Arctic Ocean thinning, why it's important to observe that etc etc. And I also mentioned that while talking about the condition of the Arctic Ocean through the seasons, the climate and the ocean dynamics must also be observed since they're directly related to each other. On the 22/09/11 and 4/10/11, two articles from NASA shows and explains that the Arctic Ocean sea ice has declined to the point that it hit the 2nd lowest point in record. The lowest extent of ice in the Arctic Ocean occurred in 2007. In the September article, it is also mentioned that depending on the method of calculation, 2011 could have also exceeded the 2007 record for the lowest sea ice extent. Using the more optimistic calculation NASA and the National Snow and Ice Data Center (NSIDC), the 2011 Arctic Sea Ice Minimum was 2.38 kilometres below the average minimum extent measured between 1979 and 2000.
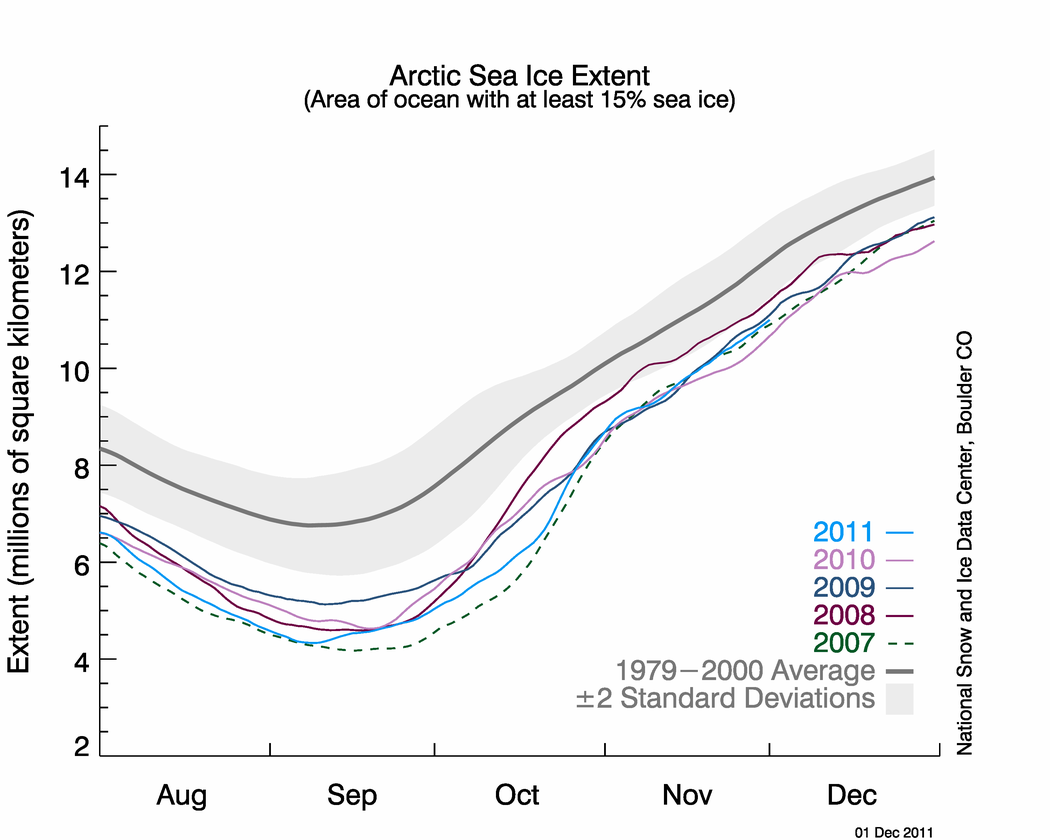 |
| Compares the Arctic Sea ice extent from the months of August to December from 2007 to 2011. It's obvious that 2007 is the dashed green line and 2011 is the light blue. (Click to go to article) |
It being the 2nd lowest sea ice extent minimum is even more worrying due to the different weather conditions in 2007 and 2011. In 2007, 'atmospheric and oceanic conditions were conducive for melting'. The skies were clear and wind patterns and warm air temperature thinned and melted sea ice. However in 2011, signs that the ice was already thinning before the melting period started in the summer of 2011 were shown in the thin and spread out ice. What is even more worrying is that the weather conditions in 2011 was typical (not conducive for melting) and yet, level neared that of 2007!

The image above appeared in the October article. It shows the extent of the sea ice in the summer of 2011. The yellow line is the 30 year average of ice extent minimum (started since satellite data collection in 1979). It's evident that the ice extent last year was much smaller! The red line is what's causing a huge wave in the shipping industry. For centuries, shipping routes had to go through the Pacific, Indian and Atlantic Ocean to get from one end of the world to the other. It took up a lot of time and money. With the Northwest Passage (red line) opening up, it could void the current shipping lines, and ports, since the usually ice obstructed path is now melting, opening up a shorter and more efficient shipping path.
There is one thing that I did neglect to mention. Remember a few posts back, there was a video about the ice cores and how far back they can date in history? The oldest ice layers are the ones right at the bottom of the sea ice and they usually occur in the thickest parts of them. These bottom layers can be considered permanent covers since they've been present for tens of thousands of years. The seasonal ice are those formed during winter but gone in summer. What's really scary is that since 1979, sea ice has been declining by 12% per decade and this includes the permanent ice layers, resulting in the ice thinning.
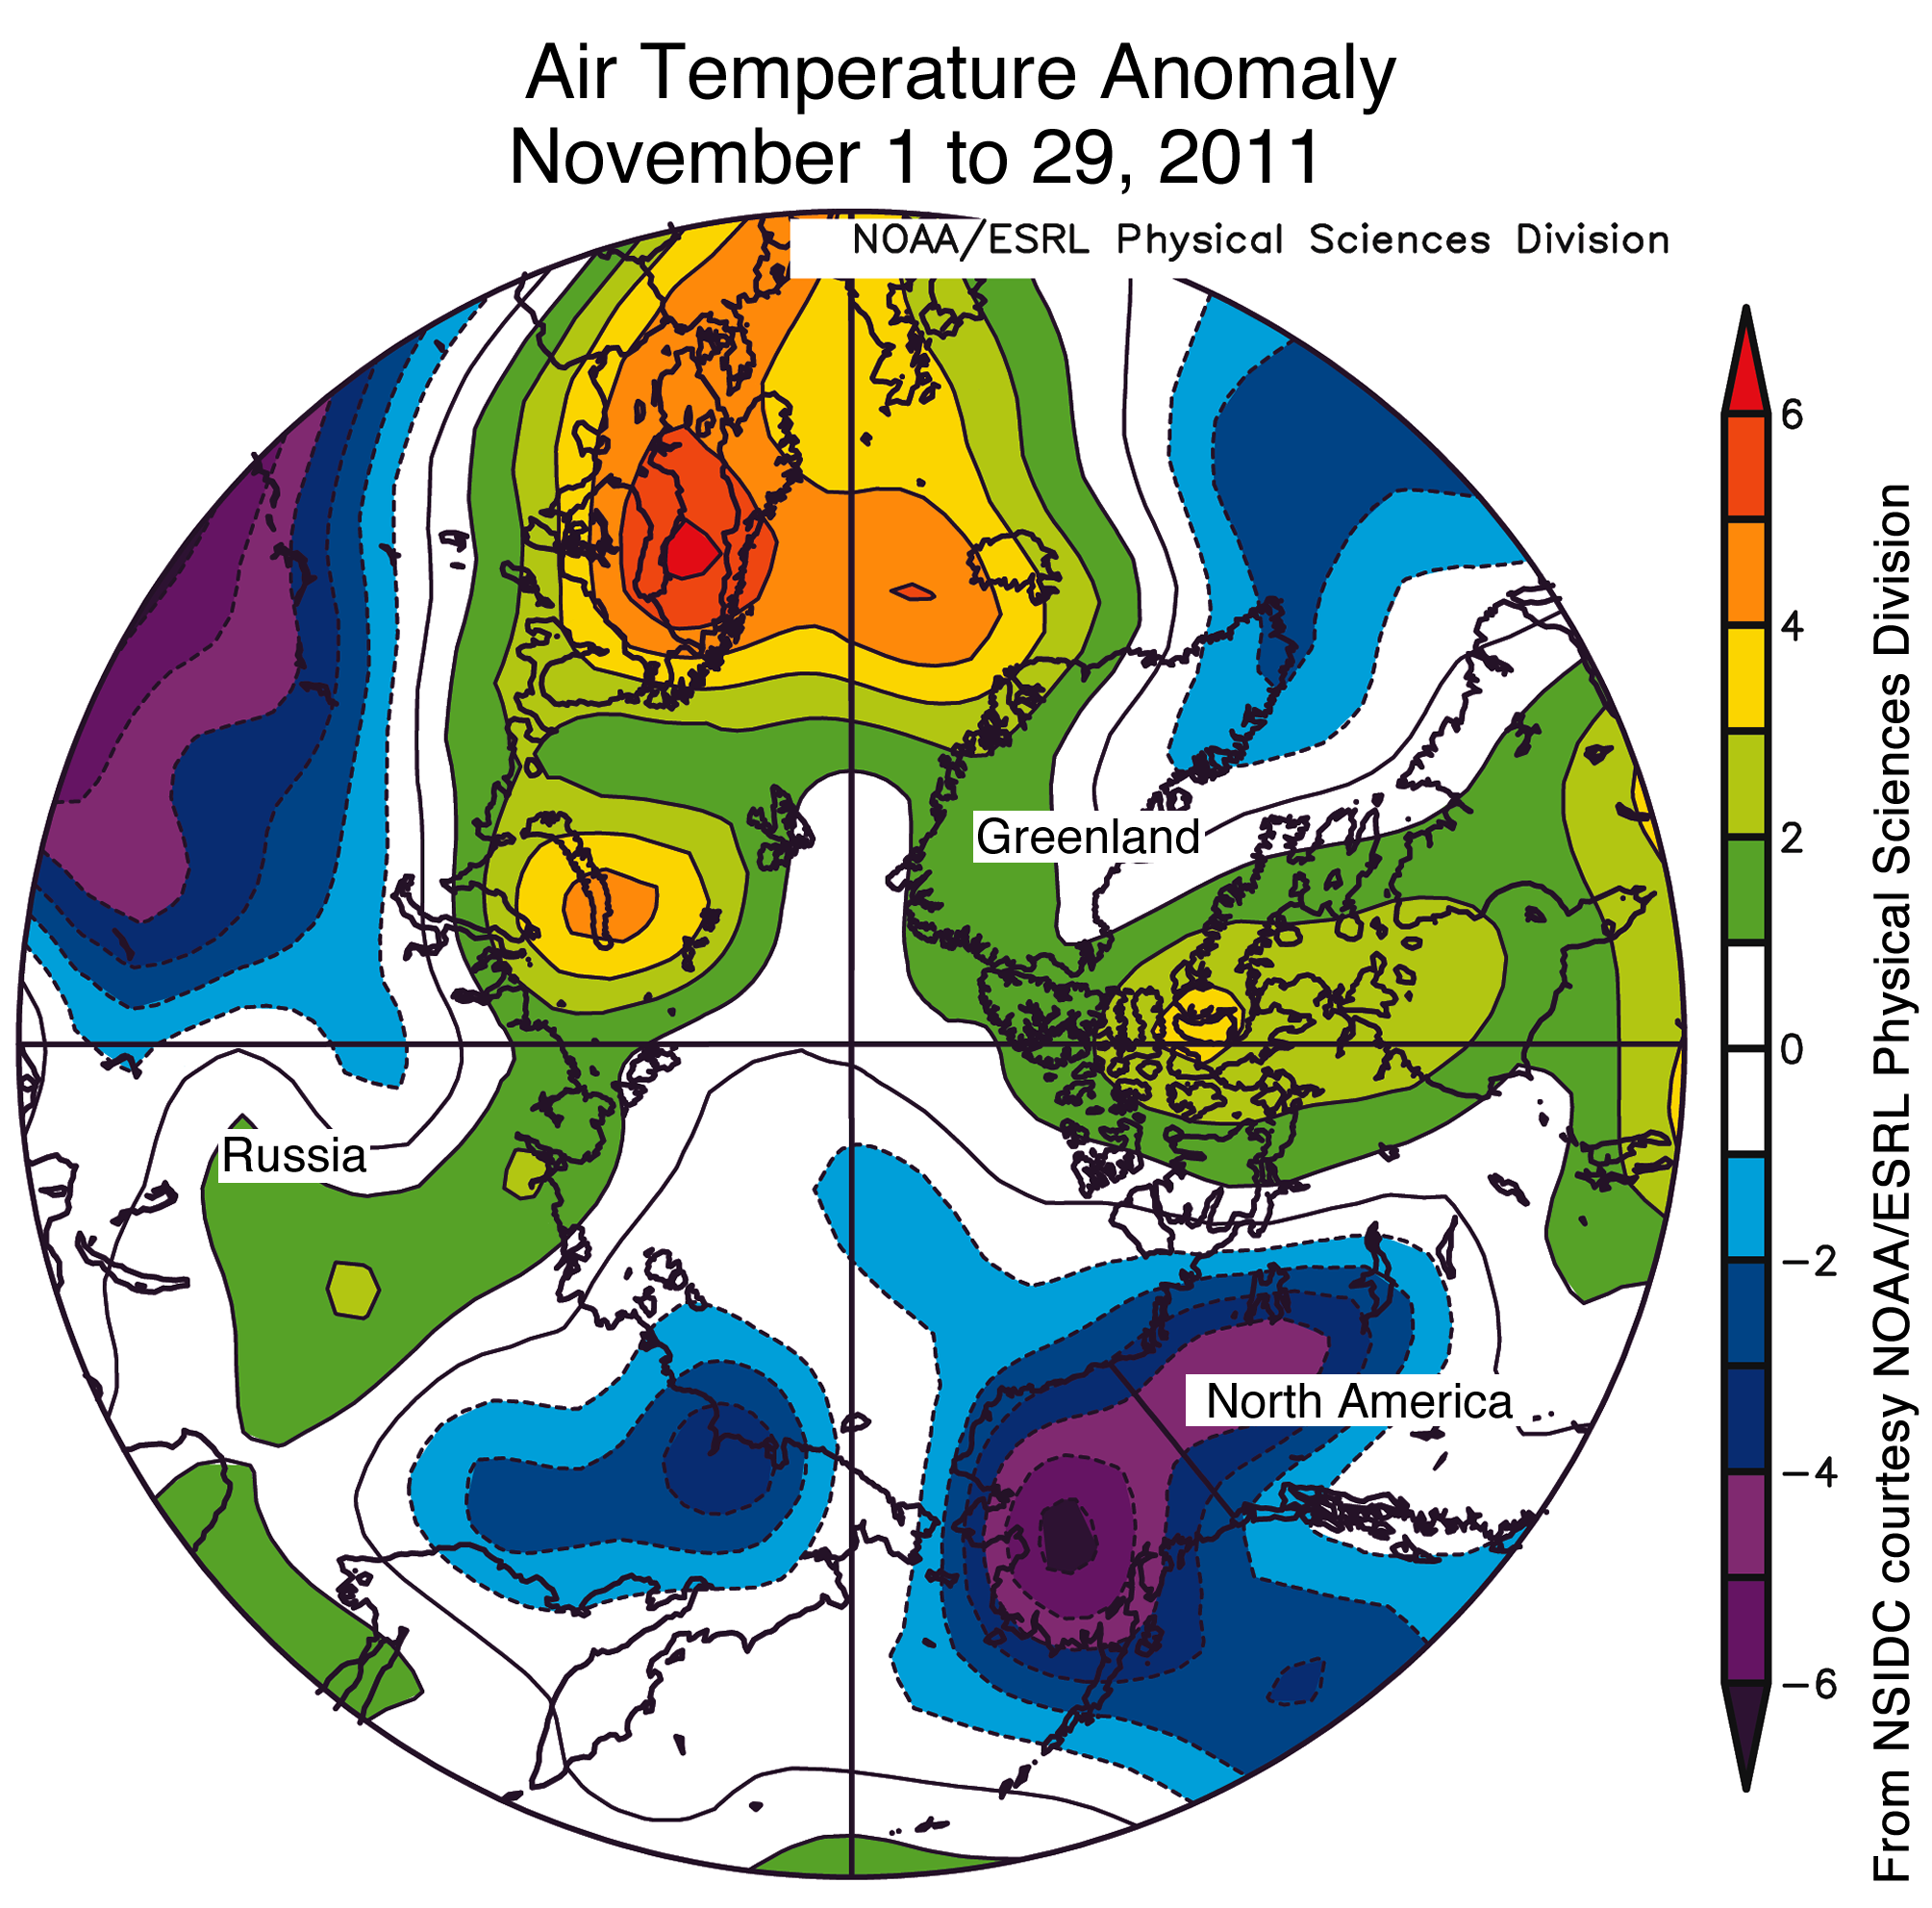
There is a video in this article that explains sea ice and the implications and possible origins of this melting. In this article by NSIDC, the above image shows the temperature anomalies at about 3000 feet. While over the Arctic Basin, temperatures are near normal and slightly below average, other areas show that temperatures and higher. The reason for this is that because of low ice extent in the summer, much of the ocean is exposed absorbing more heat (as explained in the video) which is then released over winter. There is still much in this article that I haven't written about but they're fairly self-explanatory. Do take time to read through it. It's simple and brings out the main points of each diagram without lengthy explanations.
I don't want to drag this post out any longer. I'll just leave you with this statement by Joey Comiso, scientist at NASA Goddard Space Flight Centre in Greenbelt. ' The sea ice is not only declining, the pace of the decline is becoming more drastic'. Meaning that rates of ice decline from climate models are far exceeded.
No comments:
Post a Comment